Times: 9:00 AM – 4:00 PM (Eastern)
Location: Virtual
Instructor: Andrew Schroads, SC&A
Course Registration Link – Register by September 6, 2025
Who Should Attend: The Basic Inspector Training Course focuses on issues and techniques for the early career inspector to help develop their inspection techniques and results.
About the Course: This introductory course is designed for new federal, state, local, and tribal environmental inspectors, and meets the training requirement under EPA Order 3500.1. The course provides an overview of all aspects of inspection preparation, conduct, and follow-up. The course also introduces various federal environmental laws and regulations.
The course includes lectures, discussions, exercises, and role playing.
Learning Objectives: Those completing this course will have a basic understanding of the compliance assessment practices that are employed for evaluating air emission sources.
Course Delivery: This is a classroom training that will be taught in-person in Columbus.
How to Register: See the U.S. EPA LMS Frequently Asked Questions for how to create an EPA LMS account, register for a course, and other common functions.
Agenda
Click here to see the agenda
Questions?
LADCO Training Coordinator: Zac Adelman (adelman@ladco.org)
Accessibility Statement
LADCO strives to host inclusive, accessible training events that enable all individuals, including individuals with disabilities, to engage fully with the instructor and course content. To request an accommodation or for inquiries about accessibility, please contact Zac Adelman (adelman@ladco.org | 847-720-7880).
]]>Times: 8:30-12:30 EDT
Location: Online
Instructors: William Franek and Louis DeRose
Course Registration Link – Register by September 2, 2025
About the Course: This course provides an overview of regulatory compliance assessment and enforcement tools that may be employed by the air quality agency. Proper procedures are covered for investigating an air pollution complaint, conducting an inspection, gathering evidence of an emission violation, and presenting that evidence effectively in formal hearings or court sessions. Case studies are provided to illustrate the concepts discussed.
Learning Objectives: Those completing this course will gain a basic understanding of the different types of combustion sources and the operating characteristics of each source. Attendees will be able to apply the following combustion elements in a regulatory evaluation:
- Combustion sources burning liquid and solid wastes
- Combustion sources burning fossil fuel
- Combustion engines (diesel engines, gas turbines, etc.)
- Combustion principles
- Design and operational parameters
- Selected fundamental calculations
- Pollution control devices
Course Delivery: This is a classroom training that will be taught in-person in Milwaukee at the WI DNR Offices.
How to Register: See the U.S. EPA LMS Frequently Asked Questions for how to create an EPA LMS account, register for a course, and other common functions.
Agenda
Questions?
LADCO Training Coordinator: Zac Adelman (adelman@ladco.org)
Accessibility Statement
LADCO strives to host inclusive, accessible training events that enable all individuals, including individuals with disabilities, to engage fully with the instructor and course content. To request an accommodation or for inquiries about accessibility, please contact Zac Adelman (adelman@ladco.org | 847-720-7880).
]]>Location: Online
Instructor: Andrew Shroads (SC&A, Inc.)
Course Registration Link – Register by September 17, 2025
Who Should Attend: This is an introductory course designed for agency inspectors and permit writers who conduct onsite visits to regulated facilities.
About this Course: This course presents safety procedures for inspecting and evaluating air pollution control systems. Practical techniques are described to aid plant operations personnel and regulatory agency inspectors in minimizing health and safety hazards. Emphasis is placed on the early recognition and avoidance of problems. Unique combinations of hazards found around air pollution control systems are presented. The use of personal protection equipment is discussed. This course is intended to supplement general industrial hygiene and safety procedures which should be followed by all personnel engaged in field work.
Learning Objectives: Those completing this course will gain a basic understanding of the information associated with expected safety procedures that should be followed when evaluating air pollution control systems. Attendees will be able to identify critical safety parameters associated with the following potential hazards encountered in an inspection:
• Inhalation hazards
• Burn hazards
• Electrical shock hazards
• Explosion and fire hazards
• Proper ladder climbing techniques
• Hazards involved in walking on elevated surfaces
• Ground level walking hazards
• Eye hazards
• Heat and cold stress
• Confined space entry
• Use of portable inspection instruments
• Elements of a good safety program
Course Delivery: This is a virtual, instructor-led course
How to Register: See the U.S. EPA LMS Frequently Asked Questions for how to create an account, register for a course, and other common functions.
Agenda
Questions?
LADCO Training Coordinator: Zac Adelman (adelman@ladco.org)
Accessibility Statement
LADCO strives to host inclusive, accessible training events that enable all individuals, including individuals with disabilities, to engage fully with the instructor and course content. To request an accommodation or for inquiries about accessibility, please contact Zac Adelman (adelman@ladco.org | 847-720-7880).
]]>Times: 11:00 AM – 4:00 PM (Eastern)
Location: Virtual (Online)
Instructors: Matt Haber, Eastern Research Group
Course Registration Link – Register by September 10, 2025
Who Should Attend: This course was designed to address the needs of tribal, state, and local air agency personnel involved in the permitting and compliance assessment of existing regulatory requirements as well as those personnel involved in the development of nitrogen oxide (NOx) control programs. This class is intended for new permit and compliance engineers and scientists who are responsible for permitting, compliance, and SIP planning activities.
About the Course: This course presents fundamental information on NOx emissions from combustion sources such as industrial and utility boilers. The goal of this course is to present information that will help environmental professionals address present and future NOx control issues. The course introduces a broad range of control technology topics and identifies some of the sources for obtaining further information on these topics.
Learning Objectives: Those completing this course will gain an understanding of the mechanisms by which NOx is formed in the combustion process as well as sources of NOx emissions and the history related to regulating NOx emissions from these sources. Attendees will be able to perform regulatory reviews involving the types, applicability, capability, and limitations of available control techniques to suppress the formation of NOx emissions or to minimize NOx emissions.
Course Delivery: This is a virtual, instructor-led training.
How to Register: See the U.S. EPA LMS Frequently Asked Questions for how to create an account, register for a course, and other common functions.
Agenda
Questions?
LADCO Training Coordinator: Zac Adelman (adelman@ladco.org)
Accessibility Statement
LADCO strives to host inclusive, accessible training events that enable all individuals, including individuals with disabilities, to engage fully with the instructor and course content. To request an accommodation or for inquiries about accessibility, please contact Zac Adelman (adelman@ladco.org | 847-720-7880).
]]>Times: 11:00 AM – 4:00 PM (Eastern)
Location: Virtual (Online)
Instructors: Matt Haber (Eastern Research Group)
Course Registration Link – Register by August 14, 2025
Who Should Attend: This course is designed for semi-experienced stationary source permit engineers, inspectors, regulatory agency staff, and environmental specialists in government.
About the Course: Students who complete the course should be able to:
- Determine the type(s) of permits that apply, based on an application
- Determine if an application is complete
- Create a comprehensive, enforceable permit, based on the application, agency technical analysis and applicable regulations.
- Create a permit that can be understood by all stakeholders, and is more likely to withstand appeals.
Learning Objectives: Students who complete the course will gain knowledge on the following topics:
- Legal foundations for permit issuance
- Different types of Federal and State permits, including NSR and Title V
- Completeness determinations
- Potential to emit
- Setting emissions limits
- Setting monitoring requirements
Course Delivery: This is a virtual, instructor-led training.
How to Register: See the U.S. EPA LMS Frequently Asked Questions for how to create an account, register for a course, and other common functions.
Agenda
Questions?
LADCO Training Coordinator: Zac Adelman (adelman@ladco.org)
Accessibility Statement
LADCO strives to host inclusive, accessible training events that enable all individuals, including individuals with disabilities, to engage fully with the instructor and course content. To request an accommodation or for inquiries about accessibility, please contact Zac Adelman (adelman@ladco.org | 847-720-7880).
]]>Times (Central): 9/22 @ 10:30 – 4:30; 9/23 @ 8:30 – 4:00; 9/24 @ 8:30 – 2:30
Location: Milwaukee DNR Office – 1027 W. St Paul Ave., Milwaukee, WI 53233
Instructors: William Franek and Louis DeRose
Course Registration Link – Register by September 15, 2025
About the Course: Students successfully completing this course should have the knowledge to work on combustion-related pollution problems such as estimating the actual and potential air pollution emissions from combustion sources; reviewing applications for permits to construct combustion facilities; and developing recommendations to improve the performance of malfunctioning combustion equipment.
Learning Objectives: Those completing this course will gain a basic understanding of the different types of combustion sources and the operating characteristics of each source. Attendees will be able to apply the following combustion elements in a regulatory evaluation:
- Combustion sources burning liquid and solid wastes
- Combustion sources burning fossil fuel
- Combustion engines (diesel engines, gas turbines, etc.)
- Combustion principles
- Design and operational parameters
- Selected fundamental calculations
- Pollution control devices
Course Delivery: This is a classroom training that will be taught in-person in Milwaukee at the WI DNR Offices.
How to Register: See the U.S. EPA LMS Frequently Asked Questions for how to create an EPA LMS account, register for a course, and other common functions.
Agenda
Questions?
LADCO Training Coordinator: Zac Adelman (adelman@ladco.org)
Accessibility Statement
LADCO strives to host inclusive, accessible training events that enable all individuals, including individuals with disabilities, to engage fully with the instructor and course content. To request an accommodation or for inquiries about accessibility, please contact Zac Adelman (adelman@ladco.org | 847-720-7880).
]]>Times: 9:00 AM – 3:30 PM (Central) daily
Location: Online
Instructors: Andrew Shroads (SC&A, Incorporated)
Course Registration Link – Register by August 1 2025
Who Should Attend: This is an introductory course is specifically designed for inspectors, permit writers, and technicians who have review or inspect sources of particulate emissions utilizing control devices.
About this Course: This course is designed to give attendees a basic understanding of particulate matter, different particulate control systems, and how these systems are monitored for proper operation. Course topics include:
- Parametric monitoring
- Particulate matter formation and classification
- Mechanical separators
- Fabric filters
- Wet scrubbers
- Electrostatic precipitators
- Particulate capture and collection systems
Learning Objectives: Those completing this 3-day course will have an understanding of permitted sources of particulate matter and the control technologies used to limit emissions from these sources.
Course Delivery: Instructor-led online training
How to Register: See the U.S. EPA LMS Frequently Asked Questions for how to create an account, register for a course, and other common functions.
Agenda
Questions?
LADCO Training Coordinator: Zac Adelman (adelman@ladco.org)
Accessibility Statement
LADCO strives to host inclusive, accessible training events that enable all individuals, including individuals with disabilities, to engage fully with the instructor and course content. To request an accommodation or for inquiries about accessibility, please contact Zac Adelman (adelman@ladco.org | 847-720-7880).
]]>Times: 9:00 AM – 2:00 PM (CST)
Location: Virtual
Instructor: Gordon Pierce, CDPHE Retired
Course Registration Link – Register by May 27, 2025
Who Should Attend: This course is specifically designed for regulatory air agency personnel who operate and oversee ambient air monitoring data. This class is intended for quality assurance coordinators or managers, field or laboratory supervisors, or technicians involved with quality assurance of monitoring system data.
Course Description: This course covers the basic design and theory of ambient air monitoring, quality assurance and control methods as they relate to monitoring instruments, site development criteria and data processing. This course will address PM2.5 and other particulate methods, ozone, oxides of nitrogen, carbon monoxide, hydrocarbon, sulfur dioxide, meteorology systems, data recording systems, gas calibration systems, and zero air systems.
Learning Objectives: Those completing this course will gain a basic understanding of the general information associated with principles of ambient air monitoring. Attendees will be able to perform regulatory reviews involving the following elements of ambient air monitoring:
- Regulations and Standards
- Monitoring Networks
- Station Siting
- Instrumentation
- Documentation
- Data Handling
- Quality Assurance
- References and Resources
Course Delivery: This is a virtual instructor-led training that will use an online webinar platform to deliver the material. The instructor will use engagement exercises, such as online polls or breakout rooms, to help keep the participants’ attention during the two 1/2 day sessions.
Agenda
| Times (Central) | Subject |
|---|---|
| Day 1 | |
| 9:00 | Introduction/Course Overview |
| 9:30 | Regulations and Standards |
| 10:00 | Monitoring Networks |
| 10:30 | Break |
| 10:45 | Monitoring Networks (con’t) |
| 11:15 | Station Siting |
| 12:00 | Lunch |
| 1:00 | Measurement Process |
| 1:45 | Q & A |
| 2:00 | Adjourn (End of Day 1) |
| Day 2 | |
| 9:00 | Review of Day 1 |
| 9:15 | Measurement Process (Con’t) |
| 10:00 | Data Handling |
| 10:30 | Break |
| 10:45 | Documentation |
| 11:15 | Quality Assurance/Quality Control |
| 11:45 | References and Resources |
| 12:00 | Q & A |
| 12:30 | Adjourn (End of Day 2) |
Questions?
Instructor Contact: Gordon Pierce (glpierce87@att.net)
Training Coordinator: Zac Adelman (adelman@ladco.org)
Accessibility Statement
LADCO strives to host inclusive, accessible training events that enable all individuals, including individuals with disabilities, to engage fully with the instructor and course content. To request an accommodation or for inquiries about accessibility, please contact Zac Adelman (adelman@ladco.org | 847-720-7880).
]]>Open the LADCO Air Toxics Map App
App Description
These two applications visualize air toxics monitoring data across different locations in the Great Lakes region over time (2010 to 2023). They allow you to explore both geographical patterns and temporal trends of various annual average air toxics concentrations measured by air quality monitoring stations.
These two apps were developed by Alec Sheets (Ohio EPA) and Angie Dickens (LADCO) for the 2025 5-Year Air Monitoring Network Assessment for the Region 5 States.
Data Preparation
The apps plot the annual average concentrations of individual air toxics. These annual averages were calculated by:
- Downloading the raw toxics data from EPA’s Air Quality System (AQS),
- Replacing any values below the method detection limit (MDL) with one half of the MDL[1],
- Removing null data and data from industrial monitors,
- Calculating daily means for each POC at a site,
- Calculating daily means averaging together the daily means at all POCs at a site,
- Calculating monthly means by averaging the daily means for each site,
- Calculating annual means by averaging the monthly means, with the requirement that the site must have at least three months of data in that year.
[1] This is a common way of treating data points below the MDL, as referenced here.
LADCO Air Toxics Trends App
The app has a sidebar for selecting data and a main panel showing visualizations:
- Data Selection (Left sidebar, Figure 1):
- Start by selecting a CBSA (Core Based Statistical Area).
- Choose one or more parameters (pollutants) to view.
- Select specific monitoring stations or all stations in the area.
- Set your desired date range using the calendar inputs (optional; the default is 2010 to 2023).
- Visualizations (Main window, Figure 1):
- The trends plots show how annual average concentrations (y) changed over time (x).
- Each line represents an individual site (the average of all POCs at that site, see data preparation above). Each site has a unique color and line type combination.
- A separate panel plot is shown for each pollutant, with the units for that pollutant listed below the name of the pollutant at the top of the plot.
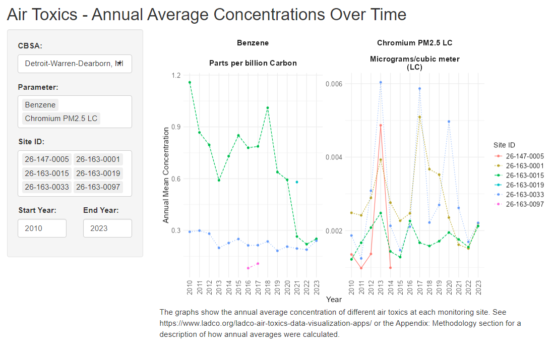
Figure 1. Screenshot of the LADCO Air Toxics Trends App, with example pollutants shown for Detroit.
LADCO Air Toxics Map App
- Data Selection (Left sidebar, Figure 2):
- Start by selecting a parameter to map.
- Use the slider to select a year to map
- Visualizations (Main window, Figure 2):
- The colors of the points in the map show how annual average concentrations vary by site across the region, where each point represents a monitoring site.
- The map is interactive, so you can zoom in on particular areas of interest or zoom out to look at the region as a whole.
- Click on a point to see the site ID, parameter name, the annual mean concentration for that year, the units, and the site operator in a pop-up window.
- Note that values in the color bar are reversed from the usual order, with the highest concentrations at the bottom (yellow) and the lowest concentrations at the top (purple). Note also that the order of these colors is different that that of the AQI scale, in which purple corresponds to highest concentrations and yellow to lower concentrations.
- The box below the slider lists the statistics (minimum, median, and maximum) for annual average concentrations across all monitors for the selected year (top) and for all years (bottom).
- The units are listed in the legend, along with the parameter being plotted.
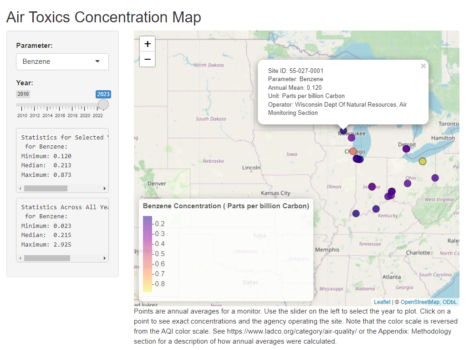
Figure 2. Screenshot of the LADCO Air Toxics Map app, with benzene shown as an example. Note the pop-up shown for one site as an example.
]]>App Description
The LADCO Urban Increment R-Shiny App displays the urban, rural, and urban increment PM2.5 concentrations for central counties in Core-Based Statistical Areas (CBSAs) across the lower 48 states. Users can select one or more states, one or more CBSAs in the selected states, and then one or more counties in the selected CBSAs to display stacked bar charts and tabulated urban increment data. Descriptions of the data and methods used to develop this tool follow.
This version of the app has been updated from the original app in several ways. (1) Urban areas are now defined based on CBSAs rather than land use classified as urban. This is computationally much faster. In the Great Lakes region, there is excellent overlap between the two definitions of urban areas. (2) Rural PM2.5 is averaged within a 150-mile radius of the CBSA rather than by state. These averages are more representative of the rural background around the urban area, and this approach more closely parallels EPA’s monitor-based approach (described below). (3) Urban increments are given for each county in an urban area rather than for the urban area as a whole. This provides more details about variation in the urban increment within urban areas. (4) Users can choose to display the urban increment based on the mean, 90th percentile, or maximum grid cell in the county.
Background
With the promulgation of a revised annual PM2.5 standard in February 2024 there is a demand for new air quality analysis products to understand the current profile of particulate pollution in the U.S. One of the data analysis products that contributes to the nonattainment area designations process is an urban increment analysis (see section 1.4 of US EPA, 2024). Per this memo, “the goal of the urban increment analysis is to estimate the local contribution to urban PM2.5 as measured at violating regulatory monitor sites and thereby provide additional evidence to consider in deciding which nearby areas with sources contributing to the monitored violations in the area to include within the boundary of the designated nonattainment area.”
The conventional approach for an urban increment analysis is to use surface monitors sited in urban and rural areas to estimate an urban increment at potential violating monitors. The urban monitors are part of the Chemical Speciation Network (CSN), and the rural PM2.5 concentrations are estimated using data from the IMPROVE program. The urban increment is simply the difference between a period-averaged concentration at the urban monitor and an analogous concentration at rural monitors that are within 150 miles of the urban site. Given the sparsity of the IMPROVE network, particularly in the Great Lakes region, there is an opportunity to explore alternative urban increment analyses that are based on PM2.5 data with more continuous spatial coverage.
Satellite PM2.5 Data
The Atmospheric Composition and Analysis Group at Washington University have developed satellite-derived global and regional PM2.5 data (Figure 1). These data are a fusion of satellite, modeled, and surface data. The fused data are estimated for “annual and monthly ground-level fine particulate matter (PM2.5) by combining Aerosol Optical Depth (AOD) retrievals from the NASA MODIS, MISR, SeaWIFS, and VIIRS with the GEOS-Chem chemical transport model, and subsequently calibrating to global ground-based observations using a residual Convolutional Neural Network (CNN).” The V6.GL.02.02 data are available for 1998-2022 on a 0.01 degree grid. Given the spatial continuity of these data and their relatively high correlation with surface observations, they provide a viable alternative to surface monitors for use in an urban increment analysis.
Methods
We used a GIS (ArcGIS Pro 3.3.2) to conduct all of the calculations and data processing steps for this analysis. The basic approach was to convert the netCDF gridded PM2.5 data to a raster, separate the raster into rural and urban PM2.5 rasters, and then use zonal statistics to get the concentrations in the rural and urban areas. Urban areas were defined as central counties within a metropolitan CBSA, and rural areas were defined as areas in the U.S. within 150 miles of a CBSA and outside an urban area. With the urban and rural concentrations, we could then calculate the urban increment in each urban county. Note that urban concentrations were calculated as either county means, 90th percentile values, or maxima. 90th percentile values are most likely to track concentrations at the controlling monitors. Additionally, the use of CBSAs to define urban areas should work well for most of the U.S. but will include vast rural areas in parts of the western U.S. where counties and their related CBSAs are very large. The detailed steps and data that we used are described below.
This app was developed by Zac Adelman and Angie Dickens at LADCO.
Data
- PM2.5 data: 2022 global 0.01 degree PM2.5 data in netCDF format (Washington University V6.GL.02.02)
- CBSA definitions: Census Core-Based Statistical Area (CBSA) to Federal Information Processing Series (FIPS) County Crosswalk (National Bureau of Economic Research, July 2023)
- U.S. Counties Map: USA Census Counties layer from the ESRI Living Atlas (dtl_cnty, accessed October 2024)
Processing Steps
- Use R to convert netCDF PM2.5 data to a raster and window in on the contiguous U.S. (download R code).
- Load the PM2.5 raster (Figure 1) and the CBSA County Crosswalk into ArcGIS Pro.
- Join the CBSA County Crosswalk table to the USA Counties map.
- Develop an urban areas (CBSAs) layer by selecting and deleting counties in the attribute table for the joined CBSA-Counties layer that: (a) are not in a CBSA, (b) are in a micropolitan CBSA, or (c) are in outlying counties of a CBSA. This will leave just central counties in a metropolitan CBSA (Figure 2).
- Develop a rural PM2.5 layer for areas in the counties layer but not in the urban areas layer (Figure 2).
- -Prepare to combine the layers:
- -Adjust the extents to match: Use Clip Raster to clip the counties and urban area (CBSA) rasters to the extent of the PM2.5 raster.
- -Handle missing data explicitly using Raster Calculator to specify that NoData points should be 0s.
- –Resample each raster to the PM2.5 raster to adjust grids so that they match exactly.
- -Combine the counties and urban area (CBSA) layers with the PM2.5 layer using Raster Calculator and the conditions that the adjusted urban areas layer = 0 (i.e., is not urban) and the adjusted counties layer = 1 (i.e., is in a U.S. county).
- -Prepare to combine the layers:
- Calculate the (a) mean, (b) 90th percentile, and (c) maximum PM2.5 within urban CBSA counties (Figure 3). This will calculate the concentration for each county. Use Zonal Statistics as Table to combine the PM2.5 layer with the urban areas (CBSA) layer and calculate the mean using statistics type = (a) Mean, (b) Percentile, with percentile set to 90, or (c) Maximum.
- Calculate the mean PM2.5 within rural areas within 150 miles of a CBSA (Figure 5).
- -Merge all counties in a CBSA into one polygon using Dissolve.
- -Apply a 150 mile buffer to this CBSA layer using the Buffer tool. You will have buffers for each CBSA (Figure 4).
- -Use Zonal Statistics as Table to combine the PM2.5 layer with the buffer layer and calculate the mean using statistics type = Mean. This step calculates the average PM2.5 in rural areas around each CBSA (Figure 5).
- Combine the urban and rural PM2.5 layers by joining the two attribute tables by CBSA. This will give you a layer with entries for each county, with the CBSA mean rural concentration and the county mean, 90th percentile, and maximum urban concentration.
- Calculate the urban increment by creating a new field in the attribute table of the new combined layer and using Calculate Field to subtract the rural mean PM2.5 from the urban mean/90th percentile/maximum PM2.5 (Figures 6-8). Figure 9 shows the 90th percentile urban increments zoomed in on and scaled to the Great Lakes region.
- Also calculate the mean/90th percentile/maximum PM2.5 for each CBSA as a whole using Zonal Statistics as Table.
Results
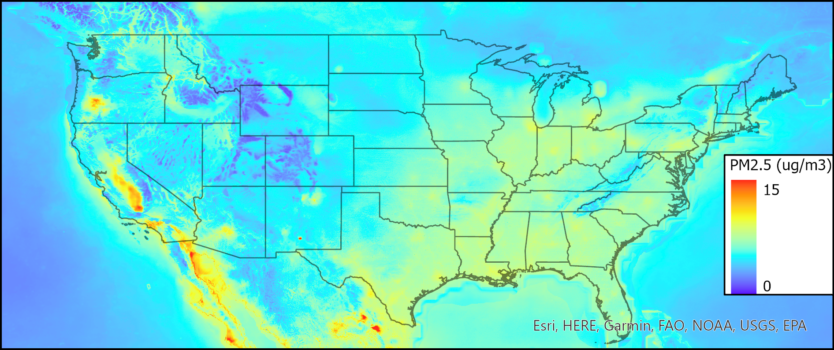
Figure 1. Washington University 0.01 degree 2022 average PM2.5.
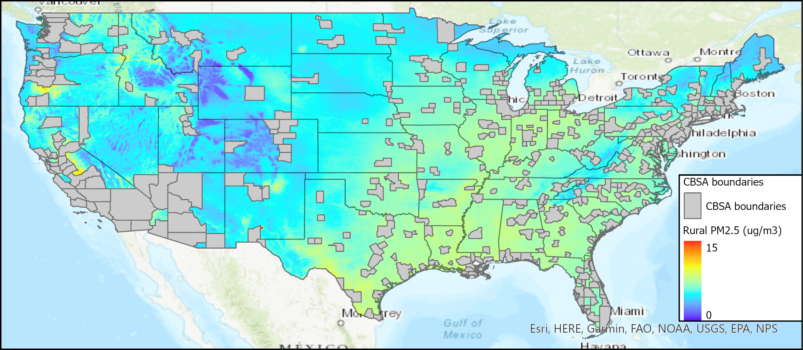
Figure 2. Metropolitan Core Based Statistical Areas (CBSAs, central counties only) and PM2.5 concentrations in rural areas in the U.S.
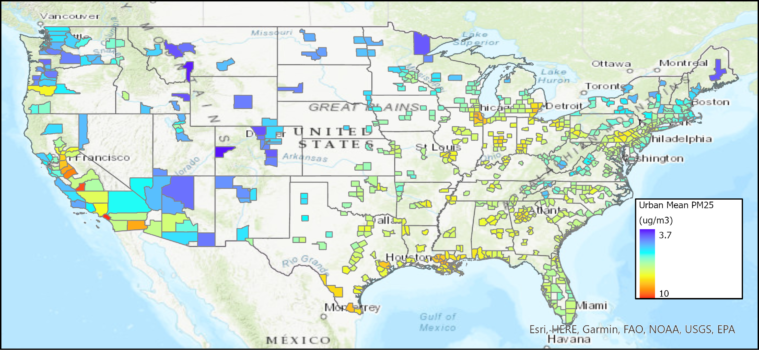
Figure 3. Mean PM2.5 for urban counties (central counties in metropolitan CBSAs).
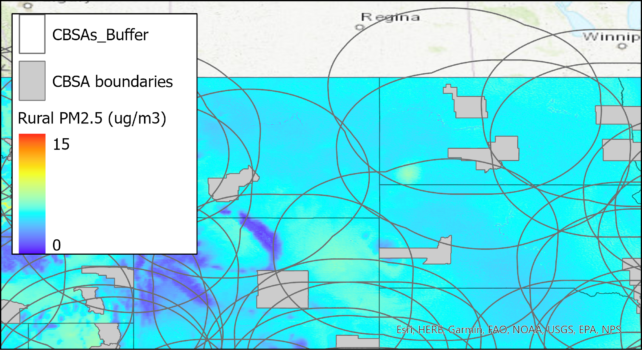
Figure 4. Metropolitan CBSA and rural PM2.5 with 150-mile buffers around CBSAs, zoomed in on the northern Great Plains region. The colored areas within each buffer were subsequently averaged to give the mean concentrations shown in Figure 5.
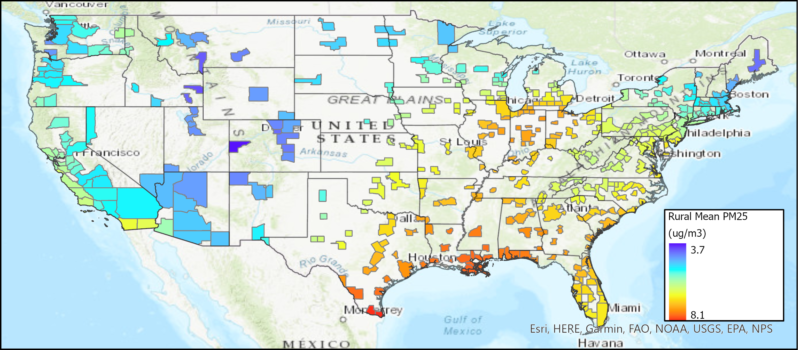
Figure 5. Mean PM2.5 for rural areas in the U.S. within 150 miles of each CBSA. Concentrations are given for each CBSA as a whole.
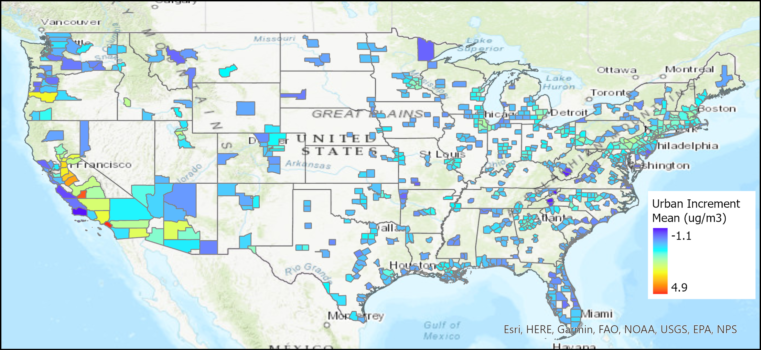
Figure 6. Urban increment based on the mean concentration for urban counties, determined as the difference between the mean urban and mean rural PM2.5 concentrations.
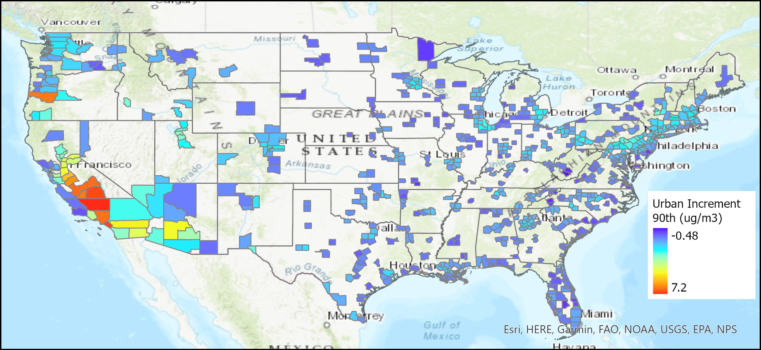
Figure 7. Urban increment based on the 90th percentile concentration for urban counties, determined as the difference between the 90th percentile urban and mean rural PM2.5 concentrations.
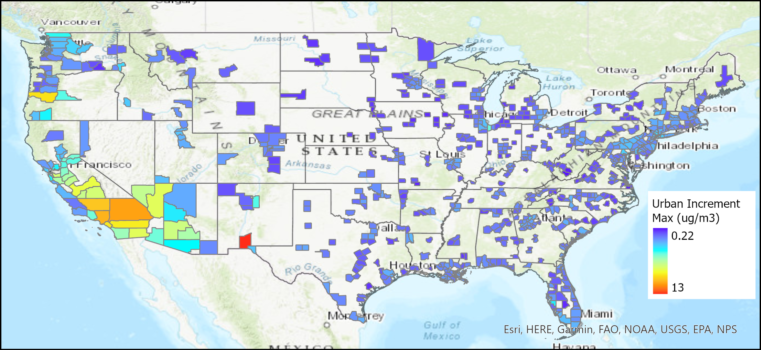
Figure 8. Urban increment based on the maximum concentration for urban counties, determined as the difference between the maximum urban and mean rural PM2.5 concentrations.
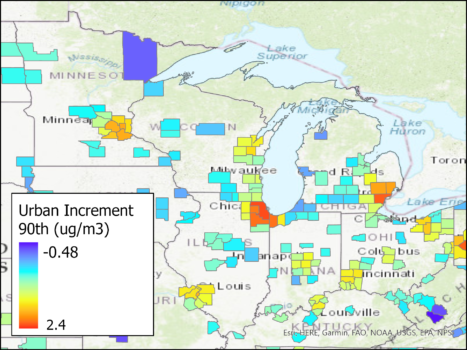
Figure 9. Urban increment based on the 90th percentile concentration for urban counties in the Great Lakes region.
]]>